
Can Denmark’s high voltage grid handle a quadrupling of wind and solar?
22 April 2022
As electric utilities plan for a tsunami of electric vehicles and heat pumps, and a fresh boom of onshore wind and solar farms, it is interesting to look at the grid’s basic features: value and age. The value of the grid gives a rough indication of how much it cost, historically, to connect production (mostly at high voltage) and consumption (mostly at low and medium voltages), while both the value and age offer anecdotal evidence for the grid’s current condition and future readiness.
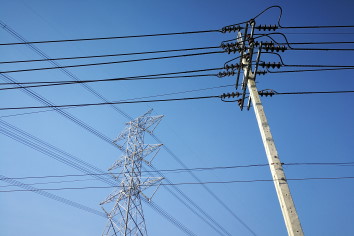
Utiligize maintains a model of the Danish grid that builds upon inventory reports by all DSOs submitted to the Regulatory Authority, Forsyningstilsynet. As can be seen below, the cost of the high voltage (30-50-60kV assets) is minuscule compared to everything else.
| Asset | Value of grid (%) |
| 0,4kV Cables | 38.9 |
| 10-15-20kV Cables | 27.3 |
| 10-15-20/0,4kV Transformers | 9.2 |
| 30-50-60/10-15-20kV Transformers | 1.9 |
| 30-50-60kV Cables/Lines | 5.2 |
| Other | 17.5 |
| Sum | 100.0 |
Possible explanations for the high voltage grid making up so little include:
- Lagging investment, which can be confirmed if there have been overvoltages in recent years; and/or
- Historically, high voltage customers were more centralized, e.g. combined heat and power (CHP)
We can investigate this further by expanding our model with lifetime estimates from cnaim.io. This gives the following age distribution:
This distribution is similar to what we see in our DER Report: the power system is really quite old, with some of it from the 1950s and 1960s when different regions switched from direct current (DC) to alternating current (AC)! But the high voltage grid has clearly experienced the most investment lately, so the surprisingly low value of the high voltage grid is probably because it was built to serve a few large units.
The shift to renewables, and especially solar, will potentially increase costs more than controllable generation, because their lower capacity factors (~13% for solar, ~30% for wind in Northern Europe) makes them a worse fit with consumption (lower coincidence factors) if cost reflective (geographically differentiated) tariffs are used.
This is just one factor in an accelerating build-out of the high voltage grid, which will definitely happen given this week’s Danish government announcement that onshore wind and solar should quadruple by 2030.
At Utiligize, we have developed a forward-looking Asset Management solution that can help DSOs reduce CAPEX by up to 35% and OPEX by up to 25%. Get in touch if you’d like a demo!